New Paper Published: Tropical Atlantic Climate Modes Shape Decadal Sea Level Along the U.S. East Coast
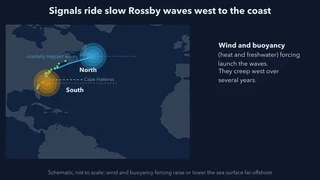 Open-ocean signals travel west as slow Rossby waves and reach the coast years later. Still from the explainer video below; schematic, not to scale.
We are delighted to share that a new paper led by Yingli Zhu, a former postdoctoral researcher in the group co-mentored by Aneesh Subramanian and Weiqing Han and now at the Institute of Oceanology, Chinese Academy of Sciences, has been published in the American Geophysical Union journal Geophysical Research Letters. The study asks where the decade-long swings in U.S. East Coast sea level come from. It finds that most of the signal starts far offshore and that the tropical Atlantic matters as much as the extratropical North Atlantic.
Why Decadal Sea Level Matters
Tide gauges along the U.S. East Coast record more than the long-term rise. On top of it, sea level swings by several centimetres over periods of a decade or more. These swings can temporarily speed up local sea level rise or offset it, so nuisance (high-tide) flooding happens far more often in some decades than in others. Earlier work linked the swings to two extratropical climate modes, the North Atlantic Oscillation (NAO) and the Atlantic Multidecadal Oscillation (AMO). The role of tropical Atlantic modes had not been examined explicitly.
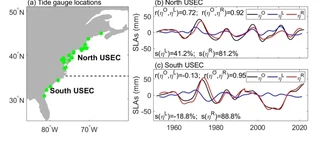
Most of the Signal Comes From the Open Ocean
The team used 22 tide gauges with records from 1950 to 2023, removed the global mean sea level and the long-term trend, and kept only variability slower than about eight years. They then split the coast at Cape Hatteras. A barotropic coastal ocean model, driven by alongshore wind stress and the inverted-barometer effect of air pressure, isolates the locally forced part of the signal; the remainder is attributed to remote forcing from the open ocean. Local forcing explains 41.2% of the decadal variance north of Cape Hatteras, but in the south its contribution is negligible or even opposing (−18.8%). Remote forcing explains 81.2% in the north and 88.8% in the south.
The remote signal reaches the coast mainly on first-mode baroclinic Rossby waves: broad, slow undulations of the ocean’s density structure that travel westward across the basin over several years. At the western boundary, coastally trapped waves carry the signal along the continental shelf. A simplified Rossby wave model reproduces about half of the remotely forced variance: 41.2% in the north and 55.6% in the south. Both wind and buoyancy forcing (surface heat and freshwater fluxes) launch these waves. Wind-driven waves dominate across most of the North Atlantic, whereas buoyancy-forced waves matter most in the western basin and the Labrador Sea.
Tropical Modes Rival the Extratropics
To compare climate modes, the authors used a Bayesian Dynamic Linear Model. Unlike conventional linear regression, it allows each mode’s influence to drift over time, so it can follow decadal shifts in where a mode’s action centres sit. The Rossby waves forced by each group of modes explain these shares of the remotely forced variance:
| Tropical (AMM + Atlantic Niño) | Extratropical (NAO + AMO) | |
|---|---|---|
| North of Cape Hatteras | 34.6% | 25.9% |
| South of Cape Hatteras | 27.7% | 40.9% |
The tropical Atlantic modes rival the extratropical ones and exceed them along the northern coast. The dominant tropical driver is the Atlantic Meridional Mode (AMM), a coupled pattern of tropical Atlantic sea surface temperature and winds. The influence of the Atlantic Niño is weaker, because its wind and buoyancy forcing partly cancel in the northwest Atlantic.
The AMM’s “Double Whammy”
Why should a tropical mode reach the northern coast most strongly? During positive AMM phases, an anomalous cyclonic circulation and low-pressure centre form over the North Atlantic. In the northwest midlatitude-to-subpolar Atlantic, north of about 38–40°N, the wind and buoyancy forcing associated with that circulation both lower sea level. The paper calls this a “double whammy”: the two act constructively and amplify the signal that propagates to the northern coast. Farther south, buoyancy forcing raises sea level against the wind-driven upwelling, and the two largely cancel. The authors confirmed this atmospheric bridge independently, using a 10-member Community Earth System Model (CESM1) Atlantic pacemaker ensemble and atmosphere-only experiments with the Community Atmosphere Model forced by AMM sea surface temperature patterns.
Implications for Coastal Flood Prediction
The results widen the established picture of East Coast sea level variability beyond the NAO and its local winds. Decadal sea level predictions and coastal flood risk assessments need to account for the tropical Atlantic as well as the extratropics. The authors note that Rossby waves explain roughly half of the decadal variance. The remainder likely involves the Atlantic Meridional Overturning Circulation, meridional heat transport and teleconnections from other basins, such as the El Niño–Southern Oscillation and the Indian Ocean Dipole, which remain topics for future work.
The study was supported in part by the U.S. Department of Energy (DE-SC0024263) through the group’s sea level extremes project, listed on our projects page.
A Collaborative Effort
The study was coauthored by:
- Dr. Yingli Zhu: Institute of Oceanology, Chinese Academy of Sciences; Qingdao Marine Science and Technology Center; University of Colorado Boulder
- Dr. Weiqing Han: University of Colorado Boulder
- Dr. Jianing Wang and Dr. Jian Zheng: Institute of Oceanology, Chinese Academy of Sciences
- Dr. D. L. Suhas and Dr. Aneesh C. Subramanian: University of Colorado Boulder
- Dr. L. Ruby Leung, Dr. Oluwayemi Garuba and Dr. Karthik Balaguru: Pacific Northwest National Laboratory
Congratulations to Yingli and the entire team on this publication!
Read the paper: Geophysical Research Letters (open access) · publication page
